
the control surface and its crinkliness
a placeholder for future posts
I am working on new themes for a new book, which will presumably work their way into this stack. For the moment, I just want to post a little picture, which is shaping my thinking on a lot of policy issues and might, I hope, have a little bit of inflluence on yours. This version comes from a 1977 journal article about forecasting prison riots:
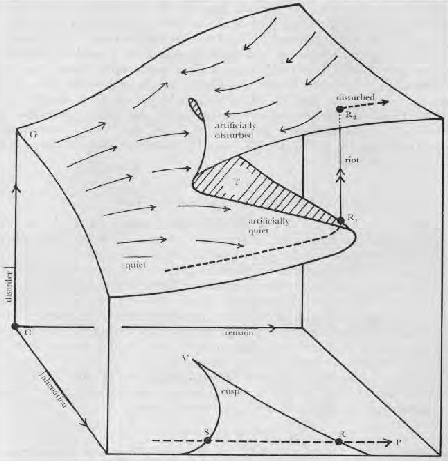
Gorgeous, isn’t it? (The thorn/shark fin at the bottom is a projection of the surface above, showing the region where the overlap happens). I made a joke about Stafford Beer’s diagrams in the book, but I actually love hand-drawn graphs in articles and hope we never lose the art.
This thing is called a “cusp catastrophe”. Invented by Rene Thom but mostly associated with Christopher Zeeman, who was the lead author on the article I’ve clipped in from. It’s trying to show how, quite often, the relationship between two control parameters and an outcome variable can be discontinuous.
In this case, the two control variables are “tension”, basically meaning how angry the prisoners are and “alienation” meaning how good or bad their ability to communicate with the authorities other than by rioting. The vertical axis is “disorder” and a riot is defined as a sudden increase. The three dimensional form is called a “catastrophe because at some points it’s bifurcated - the solution just suddenly jumps from one region to another. Also note that once the jump has been made, it’s not easily reversible; the jump to the “riot” outcome also moves you to a different part of the control surface, and you have to reduce the tension parameter a lot more to get back to where you were in terms of disorder. And that the location of the cusp for the tension depends on the level of alienation.
Taking a step back, note that many policy (and political) debates are carried out in a framework which implicitly assumes that the control surface is nice and smooth, not like the cusp catastrophe:

“Catastrophe theory” has a lot of problems, but it is a good metaphor, in my view - it’s expanding our inventory of mental models to take into account how things might happen that are otherwise hard to explain. Whenever I hear someone talking about “tradeoffs” in policy, this is the picture that flashes into my mind - you can see that at every point in this diagram, there are tradeoffs, but that doesn’t mean that every point is easily accessible by changing a parameter and it doesn’t mean that the outcome of nudging the big dial a little is going to be predictable.
Short version of this post: social engineering is impossible. We cannot draw those graphs with lines and numbered axises because we do not know how to reliably measure either factor or have equations to draw the lines.
The concepts should be useful antidotes to social engineers’ hubris. But they are not.
Back in the before times when I dabbled in dynamic simulations that were linear transformations I came across non linear transformations. One thing stuck in my peabrain; in a path dependent situation you jump from one state to the other but you don't get the jump when you reverse the path. The possibilty of this behavior in our warming planet indicates we can't just stop adding carbon and return to a cooler world.